


How Repair Shops Should Track LCD Return Rates?

This guide is written for wholesalers, distributors, importers, repair chains and independent repair shops sourcing iPhone LCD screens in bulk - not for individual iPhone owners looking for a repair quote.
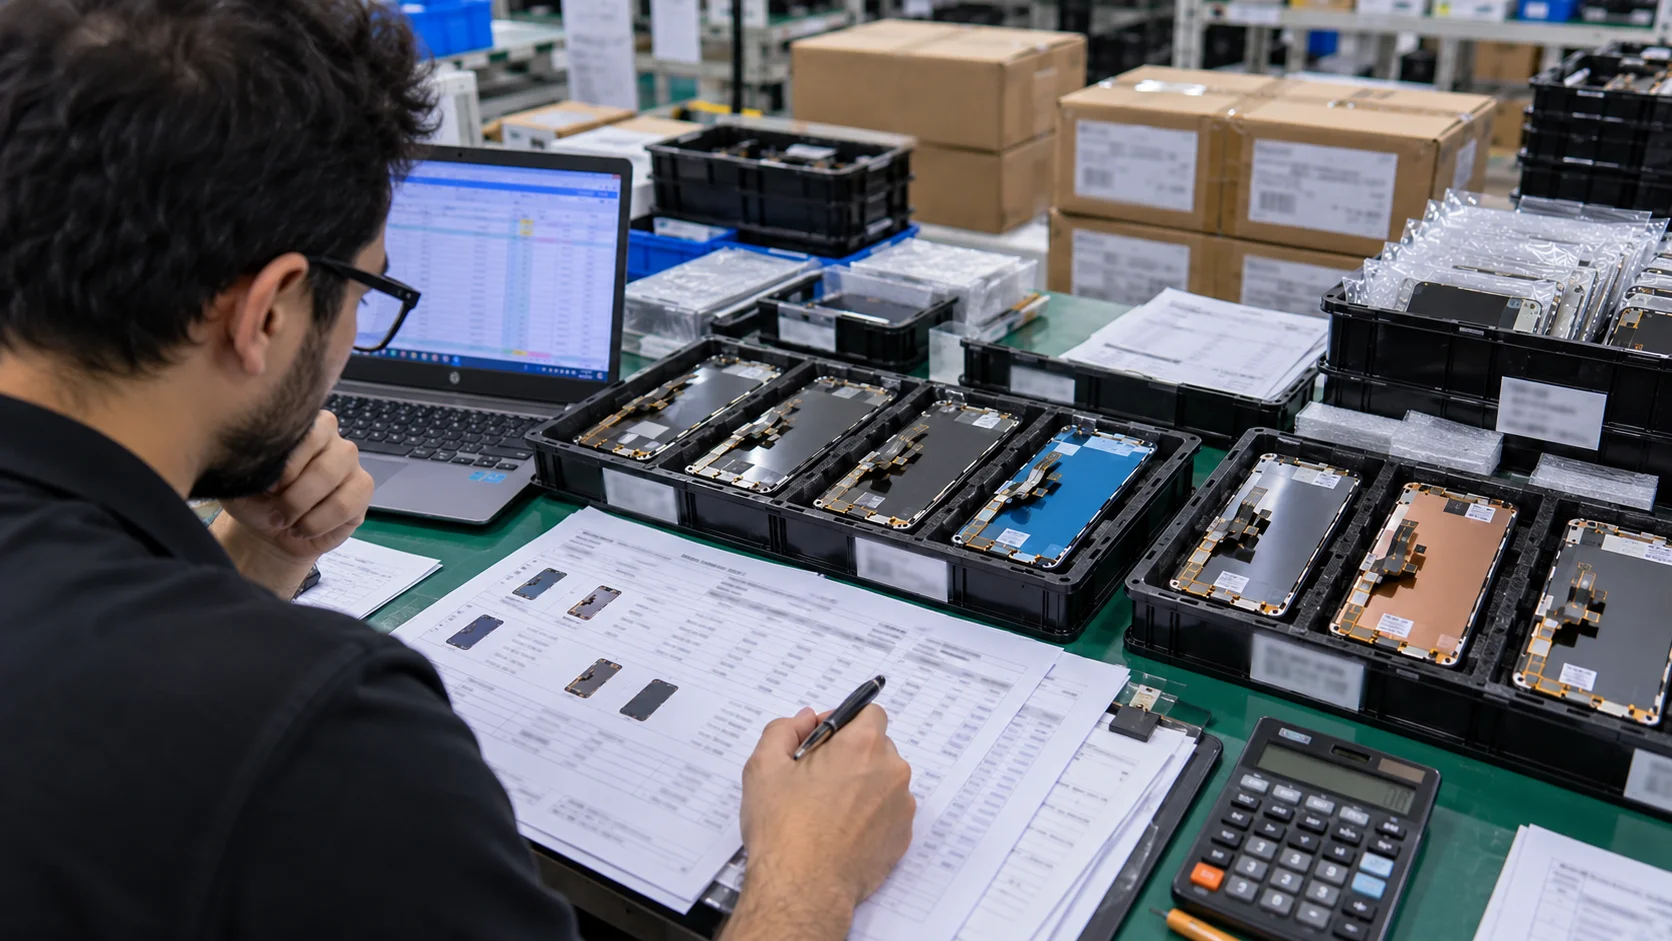
For a repair shop or repair chain buying replacement screens by the hundreds or thousands each month, a handful of returns can look like background noise - until the same symptom starts showing up on the same model, from the same batch, more than once. The real question isn't how many screens came back this month. It's what those returns actually tell you. The practical approach is straightforward: define what counts as a return, apply a consistent denominator, record every case by model, supplier and batch, then separate confirmed defects from installation or handling damage before the data is used to guide a purchasing decision.
Why LCD Return Rates Matter to Repair Shops?
A returned screen rarely costs just the price of the part. It usually means a technician's time spent re-diagnosing and reinstalling, a customer who has to come back or wait longer, and in some cases a warranty claim that has to be processed with the supplier. Left untracked, a rising return rate quietly erodes labor efficiency, ties up inventory that should be moving, and makes it harder to plan future orders with any confidence. Repair-shop margins are thin enough that this kind of hidden cost matters - which is why return tracking belongs inside a wider set of iPhone LCD return-rate reduction strategies for repair businesses, not treated as a separate reporting exercise nobody looks at until something goes wrong.
What Should Count as an LCD Return?
Before any percentage means anything, a shop needs a clear definition of what actually counts as a return. Not every screen that comes back from a customer or a technician is a confirmed manufacturing defect, and treating them all the same way will distort the data.
At minimum, separate:
- Confirmed defective LCD - inspected and tested, with a reproducible fault.
- Suspected defective LCD - reported as faulty but not yet inspected or confirmed.
- Installation-related damage - caused during fitting, not present in the part as received.
- Handling damage - dropped, crushed, or damaged in storage or transit after receipt.
- Compatibility or configuration issues - for example, a part paired with the wrong model variant.
- Customer-related issues, where applicable - damage that occurred after installation.
- Unresolved cases - returned but not yet classified.
A screen sitting in the "suspected" or "unresolved" bucket should stay there until it's actually inspected. Folding it into a defect count too early makes the number look worse - or better - than reality.
Three Return-Rate Metrics, Not One
A common mistake is treating "return rate" as a single number that answers every question. In practice, a repair business needs at least three separate metrics, each with its own numerator, denominator and purpose:
| Metric | Formula | What It Tells You | Best Used For |
|---|---|---|---|
| Sales Return Rate | Returned Units ÷ Units Sold × 100 | How often units that went out the door come back, for any reason | Spotting an overall volume trend |
| Confirmed Defect Rate | Confirmed Manufacturing Defects ÷ Units Installed × 100 | Actual product-quality performance, after installation damage and other non-manufacturing causes are excluded | Comparing product quality across suppliers or batches |
| RMA Rate | RMA Units ÷ the base defined by the shop's own warranty/RMA process × 100 | How much formal warranty/RMA activity a supplier relationship is actually generating | Tracking warranty cost and supplier responsiveness |
The first two metrics use a denominator that's easy to agree on - units sold, units installed. RMA rate doesn't have a single industry-standard base, because different supplier agreements define what qualifies for RMA differently. For iPhone LCD RMA tracking specifically, what matters is picking one definition and holding it constant from one reporting period to the next, rather than letting the base shift depending on which direction would make the number look better.
These three numbers can move independently of each other, and a shop that reports one while meaning another will end up with figures that don't match the supplier's own records - which makes any later quality conversation harder than it needs to be. The denominator matters as much as the numerator: a rate calculated against units purchased in one month isn't comparable to one calculated against units installed in a different month, and confirmed defects shouldn't be measured against all customer complaints, since that total includes cases that turn out to be installation or handling issues.
Track Returns by More Than One Dimension
A single company-wide return percentage - under any of the three metrics above - hides more than it reveals. What works better is recording enough fields on every return that patterns can be pulled out later by model, supplier or batch. Each return record works best when it captures:
- iPhone model
- LCD product or quality tier
- Supplier
- Purchase order number
- Batch or lot number
- Installation date
- Return date
- Defect category
- Symptom description
- Inspection result
- Technician notes
- Installation condition
- Final responsibility classification
- Warranty/RMA status
Build an LCD Return Tracking Table
A basic spreadsheet with the following columns is enough to start - no dedicated software is required in the early stages:
| Date | iPhone Model | Supplier | Batch/Lot | Symptom | Defect Category | Inspection Result | Root Cause | Warranty/RMA |
|---|---|---|---|---|---|---|---|---|
| 08/25 | iPhone 12 | Supplier A | B-2291 | intermittent touch | touch-related | confirmed defect | under review | RMA opened |
The row above is illustrative example data only, not an actual company record. The table's real value shows up once volume enters the picture: twelve returned units out of 600 units installed is a very different signal from twelve returned units out of 120, and a table that records model and batch alongside the return is what makes that comparison possible at a glance, rather than a raw count sitting on its own.

Weak Tracking vs Useful Tracking?
The difference between a return log that helps and one that doesn't usually comes down to specificity, not effort:
| Weak Tracking | Useful Tracking |
|---|---|
| "Screen was bad" | Symptom classified as touch failure, display line, backlight issue or physical damage |
| No model recorded | iPhone model and quality tier recorded on every entry |
| Supplier and batch not recorded | Supplier and batch/lot recorded on every entry |
| Every return treated as a defect | Suspected, confirmed and installation-related cases tracked separately |
| One return rate for the whole shop | Return rate broken down by model, supplier and batch |
Most repair shops already collect some of this information informally. The shift that matters is recording it the same way, every time, so it can actually be compared later.
Classify the Main Types of LCD Returns
Grouping returns into consistent categories makes the data usable for supplier conversations later, instead of leaving every case as a free-text description.
Display-related issues
Abnormal display, display lines, brightness inconsistency, backlight-related symptoms, and dead pixels where applicable all belong in this category. At this stage, record the symptom - don't assume the root cause yet.
Touch-related issues
Intermittent touch, unresponsive areas, abnormal touch response and recurring touch complaints on the same model are worth tracking as their own group, since touch issues often trace back to a different part of the assembly process than display issues do.
Physical or cosmetic issues
Visible damage, frame or assembly problems, and packaging or transport-related damage each point toward a different stage in the supply chain, which is exactly why they shouldn't be lumped together with functional defects.
Installation-related problems
Some returns have nothing to do with the screen itself. Before a technician assigns responsibility to a batch or supplier, it's worth having a consistent reference for how to distinguish installation damage from manufacturing defects, since the two can produce very similar symptoms on the surface even though the corrective action is completely different.
Unconfirmed or unresolved returns
Anything not yet inspected should stay in its own bucket. Folding these into confirmed-defect totals - in either direction - is one of the most common ways a return-rate number ends up misleading.

Root-Cause Analysis Turns a Percentage Into a Decision
Return-rate tracking becomes far more useful once it's paired with a consistent root-cause process. The investigation can then move through a straightforward sequence:
Customer complaint → Return received → Visual inspection → Functional testing → Installation review → Batch/supplier review → Root-cause classification → Corrective action
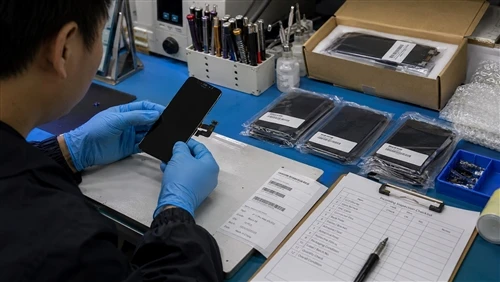
A return should not automatically become a supplier-quality claim the moment it lands on the counter. Depending on the shop's inspection process, useful evidence can include visible physical damage, functional test results, installation notes, whether the symptom has repeated, whether other units from the same batch show the same issue, technician feedback, packaging condition, and any inspection records the supplier can provide.
Consider a shop that logs eight touch-related returns in a single month: spread across four different suppliers and five different batches, that total says very little on its own - it looks like the normal, low-level noise any repair business absorbs. If those same eight instead trace back to one batch from one supplier, the picture changes completely: the number becomes a specific, actionable pattern rather than background noise, and a defect that shows up repeatedly within one batch carries more diagnostic weight than the same total scattered across unrelated batches. That distinction is often the difference between quietly reordering the same batch next month and catching a supplier-side problem before it reaches another 500 units. Grouping recurring symptoms against a reference like common iPhone LCD defects and their root causes is what turns that kind of pattern into a usable classification rather than a list of one-off complaints.

Track Return Rates by Model
A shop carrying older inventory - for example iPhone X LCD replacement screens - alongside several newer generations will often find that one model line quietly accounts for most of the returns while the rest of the catalog stays steady. Different models can carry different suppliers, different batches, different technicians and even different specifications, so a return concentrated in one model line is a meaningfully different signal than the same number spread evenly across the whole catalog.
Track Return Rates by Supplier and Batch
Return records, tracked consistently, become one of the more objective tools a repair business has for evaluating supplier consistency over time. When weighing the evidence, batch concentration is usually the strongest signal - several confirmed defects tied to one batch says more than the same count spread across many separate purchases. The confirmed defect rate itself comes next, followed by whether the same symptom keeps repeating, and finally how quickly and specifically a supplier responds once a pattern is reported.
One distinction matters more than any single data point: a single return is weak evidence on its own, while a repeated, consistently classified pattern is what actually justifies raising the issue with a supplier as a quality concern rather than a one-off complaint.

How to Use Return Data When Evaluating Suppliers?
Historical return data is most useful when it's brought into an actual supplier conversation rather than kept in a spreadsheet no one revisits. It supports discussions about batch consistency, warranty terms, replacement handling, corrective action, and future purchasing - including trial orders and direct comparisons between suppliers. When a batch pattern does emerge, having the underlying records ready before reaching out - following a consistent process for how to submit an LCD defect report - tends to get a faster and more specific response than a general complaint about "bad screens" would.
How Often Should Repair Shops Review LCD Return Data?
There's no single mandatory review frequency - the right cadence depends on order volume, risk tolerance and business size. In practice, most shops benefit from routine monitoring alongside a monthly review, plus targeted reviews triggered by specific events: a new supplier coming online, a new batch arriving, a recurring defect showing up, or a decision to increase order volume. The event-triggered reviews often catch problems faster than a fixed monthly cycle alone would.

When Does a Return Rate Become a Warning Sign?
There's no universal industry threshold that applies across every shop, supplier and product mix, so treat any specific percentage claim with caution. What's more reliable is watching for a pattern: a sustained increase over the shop's own historical baseline, repeated defects concentrated in one model, repeated defects from one supplier, a concentration of issues in a single batch, rising warranty claims, repeated customer complaints about the same symptom, or increasing labor tied to replacement work. The right response is to investigate the underlying pattern, not to react to one return in isolation.
How Return Rate Affects True Procurement Cost
A low unit price doesn't necessarily mean lower total cost if it comes with more replacement labor, more technician time, more shipping, more warranty processing, occasional customer compensation, lost productivity, repeated installations, or inventory disruption. This is generally referred to as total cost of ownership, and it's one of the clearest reasons return-rate tracking belongs in a purchasing conversation rather than only a quality-control one - a screen that's cheaper per unit but returns more often is rarely the cheaper option once labor and warranty handling are counted. Two suppliers priced a few dollars apart per unit can end up costing a shop about the same once one of them runs a confirmed defect rate several points higher than the other - the difference simply shows up later, spread across technician hours and reinstalled units instead of the original invoice.
How to Improve LCD Return-Rate Tracking?
For most repair businesses, tightening iPhone LCD return rate tracking comes down to a similar sequence of steps, whether the operation is a single shop or a larger repair chain:
- Define what counts as a return, and pick the right metric - sales return rate, confirmed defect rate, or RMA rate - for the question being asked.
- Record every return consistently, without exceptions.
- Separate suspected returns from confirmed defects.
- Classify the probable root cause.
- Track by model, supplier and batch or lot where that information is available.
- Review recurring patterns on a regular cadence.
- Use confirmed patterns to raise the issue with the supplier and guide future purchasing decisions.
A Practical LCD Return-Rate Checklist
- Record the iPhone model, supplier and batch/lot on every return
- Record the installation date and return date
- Describe the symptom and record the test result
- Check for physical damage and review the installation condition
- Classify the probable root cause
- Separate confirmed defects from unresolved or suspected cases
- Record warranty/RMA status
- Review recurring patterns on a set schedule
- Share confirmed quality issues with the supplier

The Manufacturer's Role in Supporting Return-Rate Data
On the supply side, a manufacturer's quality-control process typically touches incoming material control, production testing, batch inspection, defect recording, packaging inspection and warranty handling. How much of this can actually be verified varies by supplier - a repair business evaluating a factory should ask what records exist, rather than assume every supplier documents the same things to the same standard. Traceability back to a specific batch, in particular, is what makes a repair shop's own return data genuinely actionable in a supplier conversation instead of just a general impression.

Product Fit and Sample Testing
Return-rate tracking works best alongside sensible product selection. Different repair markets and price points call for different quality tiers, and specifications worth confirming before a bulk order - panel type, brightness range, touch digitizer specification - vary by model and by supplier. Consistency across a mixed order is worth confirming directly with a supplier rather than assumed from one earlier purchase: a shop moving into higher volumes of iPhone 11 Pro Max LCD replacement screens alongside older model lines shouldn't expect the same batch consistency to carry over automatically from one model to another.
FAQ
What is a good way for a repair shop to calculate an iPhone LCD return rate?
There isn't one single formula. A sales return rate (returned units ÷ units sold), a confirmed defect rate (confirmed manufacturing defects ÷ units installed) and an RMA rate each answer a different question. Pick the metric that matches the question being asked, and keep its definition consistent from one period to the next.
Should installation damage be included in an LCD return rate?
Generally no, if the goal is measuring product quality. Installation damage should be recorded and tracked separately so it doesn't distort the confirmed defect rate or the picture of supplier and batch performance.
Should return rates be tracked by iPhone model?
Yes. A single blended percentage can hide a problem that's actually concentrated in one model, supplier or batch, which is exactly the kind of pattern model-level tracking is designed to reveal.
How can repair shops identify recurring LCD batch problems?
By recording batch or lot numbers on every return and reviewing the data for concentration - multiple confirmed defects tied to the same batch, rather than spread across many separate purchases.
How should a repair shop report defective LCD screens to a supplier?
With a consistent, evidence-based report: model, batch or lot, symptom, inspection result, and quantity affected, rather than a general description of "bad screens."
Can LCD return-rate data help compare suppliers?
It can, as one input among several - alongside product consistency, inspection process, responsiveness, warranty handling and delivery reliability - rather than as the sole basis for a decision.
Conclusion
A useful LCD return-rate system is not simply a percentage. It's a structured record connecting the returned screen to its model, supplier, batch, symptom, inspection result and root cause. Picture a shop that notices six of its last nine touch-related returns share the same batch number: that's no longer a vague sense that "returns feel higher lately," it's a specific, model-and-batch-level finding a supplier can actually act on.
Once a shop has organized data pointing to a specific model, batch or recurring symptom, the next useful step is a direct conversation with the supplier, not another month of the same tracking. That conversation goes further when it starts with a specific ask: pull together the affected models, approximate order volumes and the batch-level pattern the data has surfaced, and use them to request our warranty terms and batch quality-control information - a documented answer that also becomes useful reference the next time order volume increases or a new supplier is being evaluated.