
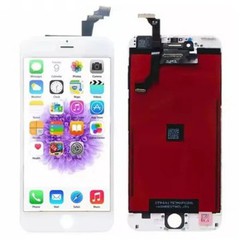
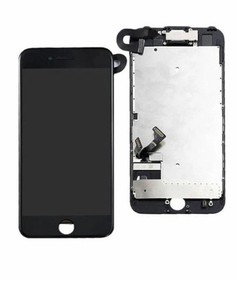
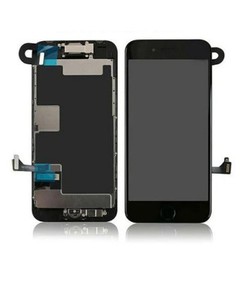
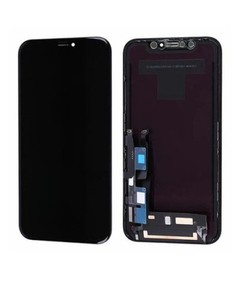

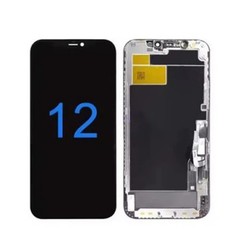
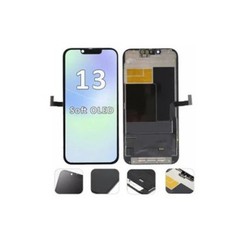



How to Identify Fast-Moving iPhone Screen Models?
Identify fast-moving iPhone screen models by checking which specific screen configurations sell repeatedly in your own market. Compare paid sales or completed repair jobs with stock availability, order frequency and customer spread. Flag one-off orders and promotions, and record warranty replacements and internal transfers separately from paid sales.
For repair businesses and wholesale buyers, a wrong call has a direct cost. A slow SKU mistaken for a fast one ties up cash, while a fast SKU hidden by a stockout leaves repair jobs waiting. This guide gives you the records, formulas and review steps, plus a five-SKU example you can reproduce with your own numbers.

Define "Fast-Moving" for Your Market and Product Range
Fast-moving status is one input into iPhone LCD inventory planning for repair businesses. Assess it within a defined market, channel, buyer group, observation period and SKU range. It does not mean the newest iPhone, the highest revenue or a model that sells well in another country.
Three different signals are easy to confuse:
- Model-level demand: customers ask for a repair on a given iPhone model.
- Approved-SKU demand: a specific screen configuration is actually sold or installed for that model.
- Supplier SKU performance: what one supplier has shipped to its downstream customers.
Approved-SKU sales show which configuration customers actually chose. Stockouts can still hide unmet demand, and sales history alone does not determine what to purchase. A model may attract frequent repair requests while its LCD replacement SKU sells slowly because customers choose another technology or specification.
Treat every approved configuration as its own SKU. Keep different specifications separate, even when they fit the same phone model. Labels such as "AAA" or "premium" do not establish a shared specification; use the written requirements and approved sample to identify the product.
An aftermarket LCD can use the same broad display technology as the original screen without being an Apple-original assembly or providing identical performance. Confirm the original and replacement technologies for each model. Sales of another configuration, including an OLED or used-original assembly, cannot be credited to your specific LCD SKU.
Build a Comparable SKU-Level Sales Record
Export line-level sales or repair records with SKU, quantity and transaction dates. A model ranking alone leaves out stock availability, exceptional orders and the configurations actually sold.
- Repair shops: paid repair jobs and the screen actually installed. Quotes and walk-in enquiries are not completed repairs.
- Repair chains: end-customer repair consumption, recorded separately from stock moved from the central warehouse to branches. A screen that travels from warehouse to branch to job counts once as customer demand, not twice.
- Distributors and wholesalers: independent external orders and actual shipments. Keep the order date and the fulfillment date as separate fields so that an old backorder released in one week does not look like a sudden jump in demand.
- Importers and private-label buyers: separate what you ship to downstream customers from what end users consume. If you have no end-user data, say that the analysis stops at your own sales level.
Identify original business by order or job number, line item and transaction type. A shipment split into three deliveries is still one order. The same enquiry received by phone and by email is still one request. Give every external customer one consistent anonymous ID, and do not count two branches of the same company as two independent buyers.
Samples, gifts, cancellations, transfers and warranty replacements need their own transaction types.
Record sales of LCD replacement screens for iPhone 11 against the approved configuration rather than the compatible model name alone, and write down the effective date whenever a specification, supplier or version changes. Otherwise, sales before and after a revision may be mistaken for one continuous trend.
Availability belongs in the same ledger. For each SKU keep the launch date, any suspension, and the periods when it was in or out of stock. Without availability records, low sales cannot reliably distinguish weak demand from limited stock.
The minimum fields for the worksheet are:
| Record group | Fields to keep |
|---|---|
| Product identity | Compatible model, display technology, supplier SKU, approved specification and revision date |
| Business scope | Market, branch or channel, observation dates and product launch or suspension dates |
| Original transaction | Order or repair-job ID, order and fulfillment dates, transaction type, paid units and anonymous customer ID |
| Availability | Verified in-stock and stockout periods, including partial-day availability |
| Exceptions and unmet requests | Event or request ID, evidence type, reason, later fulfillment and data-quality notes |
| Returns and replacements | Original sale or batch reference, warranty case and resolution |

Measure Sales Velocity Without Hiding Stockout Days
Start with the quantity that actually happened:
Original paid fulfilled units = paid external units shipped or installed in the period, excluding warranty, samples and internal transfers
Here, "paid" means a billable external sale or repair, including agreed-credit transactions. Count units at fulfillment rather than when payment is collected.
Calculate both period-wide and in-stock sales velocity:
Observed period velocity = original paid fulfilled units / calendar days in the observation period In-stock-day velocity = paid fulfilled units during verified in-stock exposure / equivalent in-stock days for the same exposure
The period-wide rate includes dates when stock was unavailable; the in-stock rate describes sales during verified availability. Record operating days separately and keep the time basis consistent when comparing periods. Each numerator must match its denominator.
If a SKU sold 38 units during 10 verified in-stock days, the in-stock figure is 3.80 units per day. Extending that rate across 18 unobserved stockout days would require assumptions about customer behaviour and demand conditions. Record documented unmet requests separately rather than presenting the extrapolation as measured demand.
Some practical rules:
- For partial-day stockouts, use verified in-stock trading hours. Report units per in-stock hour if opening hours differ; otherwise state how many trading hours make one equivalent day. A zero closing balance does not show that the SKU was unavailable all day.
- If the denominator is zero, write N/A. Do not write zero velocity or an infinite one.
- A SKU launched last week has a short exposure window, not a slow history. Mark it as insufficient data.
- Calculate inventory turnover only with cost of goods sold and average inventory valued on the same cost basis for the same period. Units per day measures sales velocity, not inventory turnover.

Separate Recurring Demand from Exceptional Sales and Warranty Use
Total units do not show whether demand recurs. Check how many orders or jobs contributed, how often sales occurred and whether one customer dominated the period. Where customer-level records are available, divide the largest customer's units by the period's original paid units to measure concentration.
A standing customer programme can generate recurring demand even when the customer base is concentrated. Check its expected continuity separately from the breadth of demand across other buyers.
| Distortion | How it misleads | What to do |
|---|---|---|
| One-off project order | One large order makes a SKU look steady | Keep the original units, flag the verified event, show the regular part beside it |
| Promotion or price change | Short-term speed looks like a normal rate | Record the conditions and compare only like with like |
| Released backorders | Demand appears in the wrong week | Compare order date with fulfillment date |
| Internal transfers | The same piece is counted as two sales | Exclude internal transfers; count each external shipment or completed repair once at the defined analysis level |
| Warranty replacements | After-sales consumption looks like new demand | Record separately and trace the original sale |
| Returns | Current-period returns divided by current-period sales gives a misleading rate | Trace to the original sale or batch before calculating any rate |
| Stockouts | Low units look like low demand | Check availability and documented unmet requests first |
Keep the raw numbers intact. Do not delete a large order because it looks unusual; show it as a separate verified line next to the regular volume. Likewise, do not assume a large customer will never buy again. Check the next periods.
Unmet requests deserve care. A confirmed order that could not be filled is stronger evidence than an unanswered price enquiry. Deduplicate them, check whether they were later fulfilled, and never add every enquiry up as lost sales.
Finally, keep three questions apart: is there demand, is the product reliable, and is it worth buying now? A SKU can sell fast and still carry a return problem, and that pattern calls for a separate quality review, not a verdict of "good" or "bad" based on sales alone.

Compare Recent Periods Within the Same Channel
A single window can mislead. Compare complete, comparable periods in the same channel, and check opening days, availability, price, promotions and product versions in each. If stock levels differed sharply between two periods, raw units tell you little about whether demand changed.
The period length should follow your sales frequency and data quality. There is no universal 28-, 30- or 90-day window. Low-frequency SKUs may require longer observation than SKUs sold every day, regardless of business size.
Do not apply a chain-wide trend to every shop. Total growth can hide a falling branch, and a rising SKU can hide a falling product version.
Historical sales support the shortlist. A forecast also needs to account for known changes in customer orders, pricing and supply conditions. A short increase does not establish long-term growth. If the base period had zero sales, report the unit change instead of a conventional percentage growth rate.
Worked Example: Read Demand Signals Across Five SKUs
Illustrative example only. These figures do not represent actual iPhone model demand, market rankings, or recommended purchasing quantities.
Assume one distributor in one market over 28 consecutive calendar days, all of which are operating days. SKUs A to E are five different, non-interchangeable approved products. Each day is either fully in stock or fully out of stock, and all paid sales occurred on in-stock days.
| SKU | Full in-stock days | Stockout days | Original paid fulfilled units |
|---|---|---|---|
| A | 28 | 0 | 84 |
| B | 10 | 18 | 38 |
| C | 28 | 0 | 100 |
| D | 28 | 0 | 16 |
| E | 28 | 0 | 4 |
| SKU | Paid orders | Distinct external customers | Days with paid sales |
|---|---|---|---|
| A | 42 | 24 | 21 |
| B | 19 | 14 | 9 |
| C | 11 | 7 | 8 |
| D | 8 | 8 | 8 |
| E | 2 | 2 | 2 |
Additional records:
- A: 2 units returned in the period, and 3 units shipped as warranty replacements.
- B: 12 units of unmet requests were logged during stockout days. They are not part of the 38 shipped units, and their evidence type and later fulfillment still need checking.
- C: One 80-unit order was verified as a one-off project. The other 20 units came from 10 regular orders, 6 customers and 7 other days. The project customer is not among the regular customers.
- D: 6 units returned and 4 shipped as warranty replacements, with the original sales batches still to be traced.
- E: No exceptional orders were recorded, only 2 orders from 2 customers.
| SKU | Units per calendar day | Units per in-stock day | Additional observation |
|---|---|---|---|
| A | 84 ÷ 28 = 3.00 | 84 ÷ 28 = 3.00 | 21 sales days, 24 customers |
| B | 38 ÷ 28 ≈ 1.36 | 38 ÷ 10 = 3.80 | 18 stockout days; full demand cannot be observed |
| C | 100 ÷ 28 ≈ 3.57 | 100 ÷ 28 ≈ 3.57 | Project = 80% of units; regular part 20 ÷ 28 ≈ 0.71 |
| D | 16 ÷ 28 ≈ 0.57 | 16 ÷ 28 ≈ 0.57 | Low observed volume; after-sales records to trace |
| E | 4 ÷ 28 ≈ 0.14 | 4 ÷ 28 ≈ 0.14 | In stock throughout; low volume and frequency |
The two-decimal figures are arithmetic, not forecast precision. Here is how to read each SKU:
| SKU | Evidence status | Reason and limit | Next action |
|---|---|---|---|
| A | Strongest fast-moving candidate in this example | Broad sales activity within this period; confirmation across comparable periods is still needed | Confirm in other comparable periods |
| B | Availability-limited, review first | Stockouts limit the comparison; the logged unmet requests do not fully describe demand during the missing days | Verify the unmet requests, then re-measure with stock |
| C | Highest raw volume, but driven by a one-off project | Regular volume is far lower than the headline; a repeat order from the project customer is possible but unproven | Watch the regular volume and ask whether the project will recur |
| D | Low observed volume, after-sales cause unknown | Replacements are not new sales; 6 ÷ 16 is not a reliable return rate; no quality conclusion yet | Trace returns and replacements to original batches |
| E | Low observed sales with full availability | One window cannot establish long-term slow movement; check pricing and customer exposure before judging the need for a low-frequency spare | Keep observing; review the reason for holding it |
Ranking by total fulfilled units puts C first and B third. Ranking by in-stock-day velocity puts B first. Neither ranking alone establishes sustained demand or purchasing priority. A SKU can also carry more than one flag, such as limited availability and an unusual project order.
Validate a Shortlist When Sales History Is Limited
A new market, channel or SKU may have no usable sales history. Treat supplier rankings as leads for local validation, then build evidence in stages:
- Log model-specific enquiries. Record the market, customer type, requested configuration and frequency. Keep enquiry evidence separate from confirmed orders and fulfilled sales.
- Check purchasing intent. Distinguish a price enquiry from an approved repair or customer purchase order, and record any price or availability conditions.
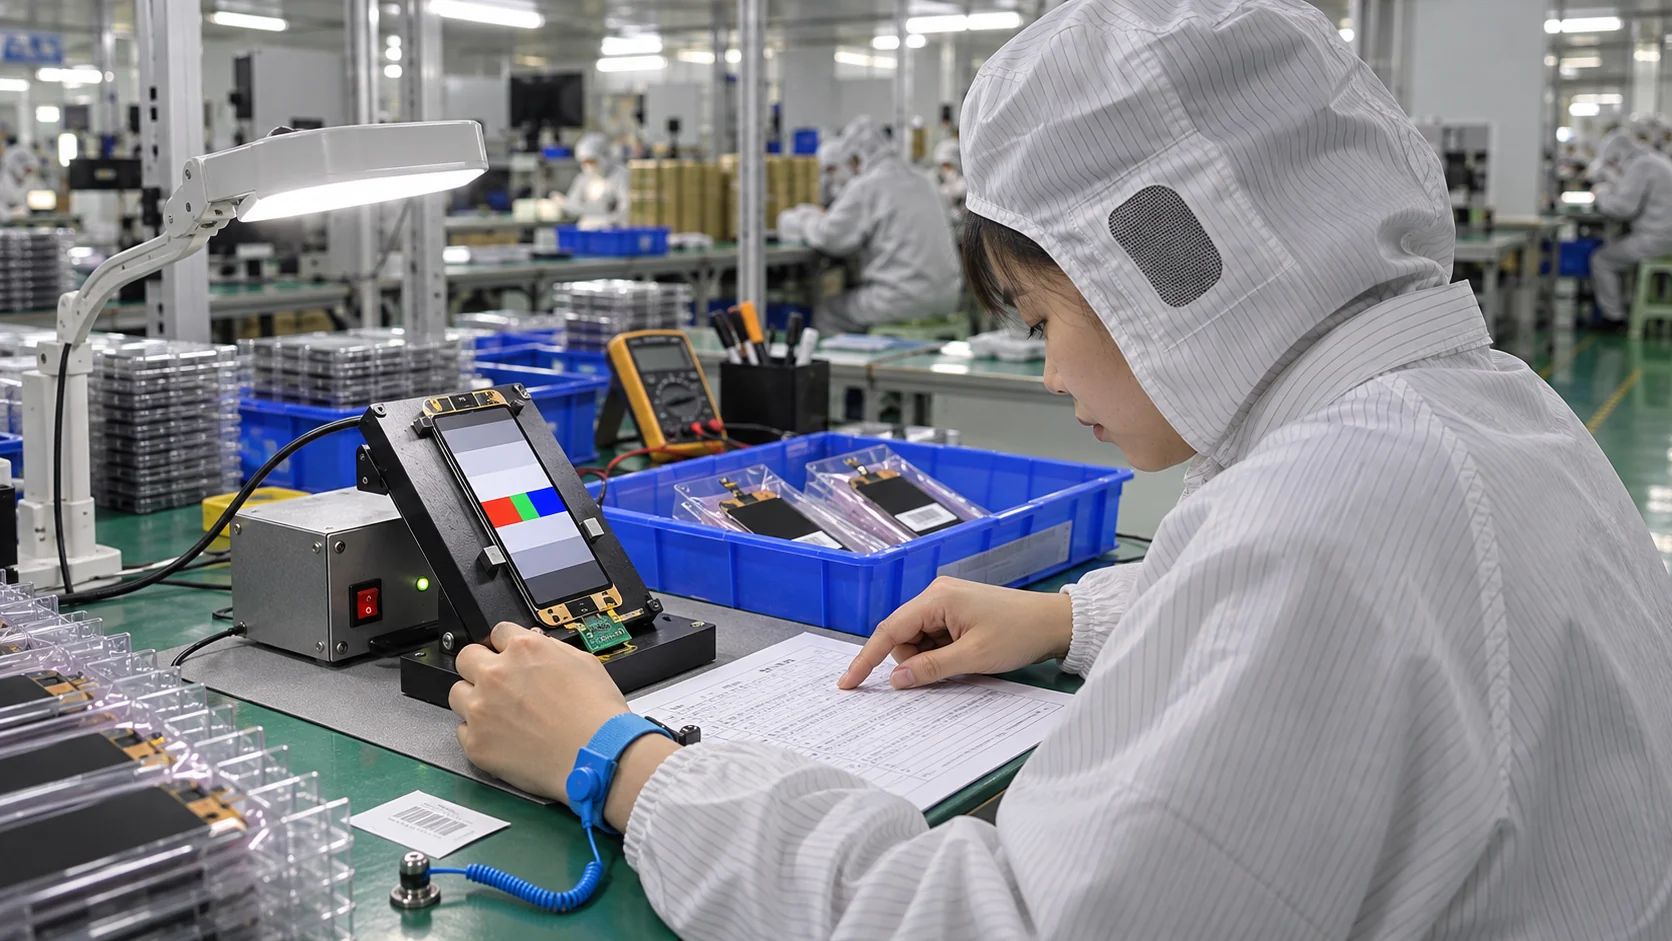
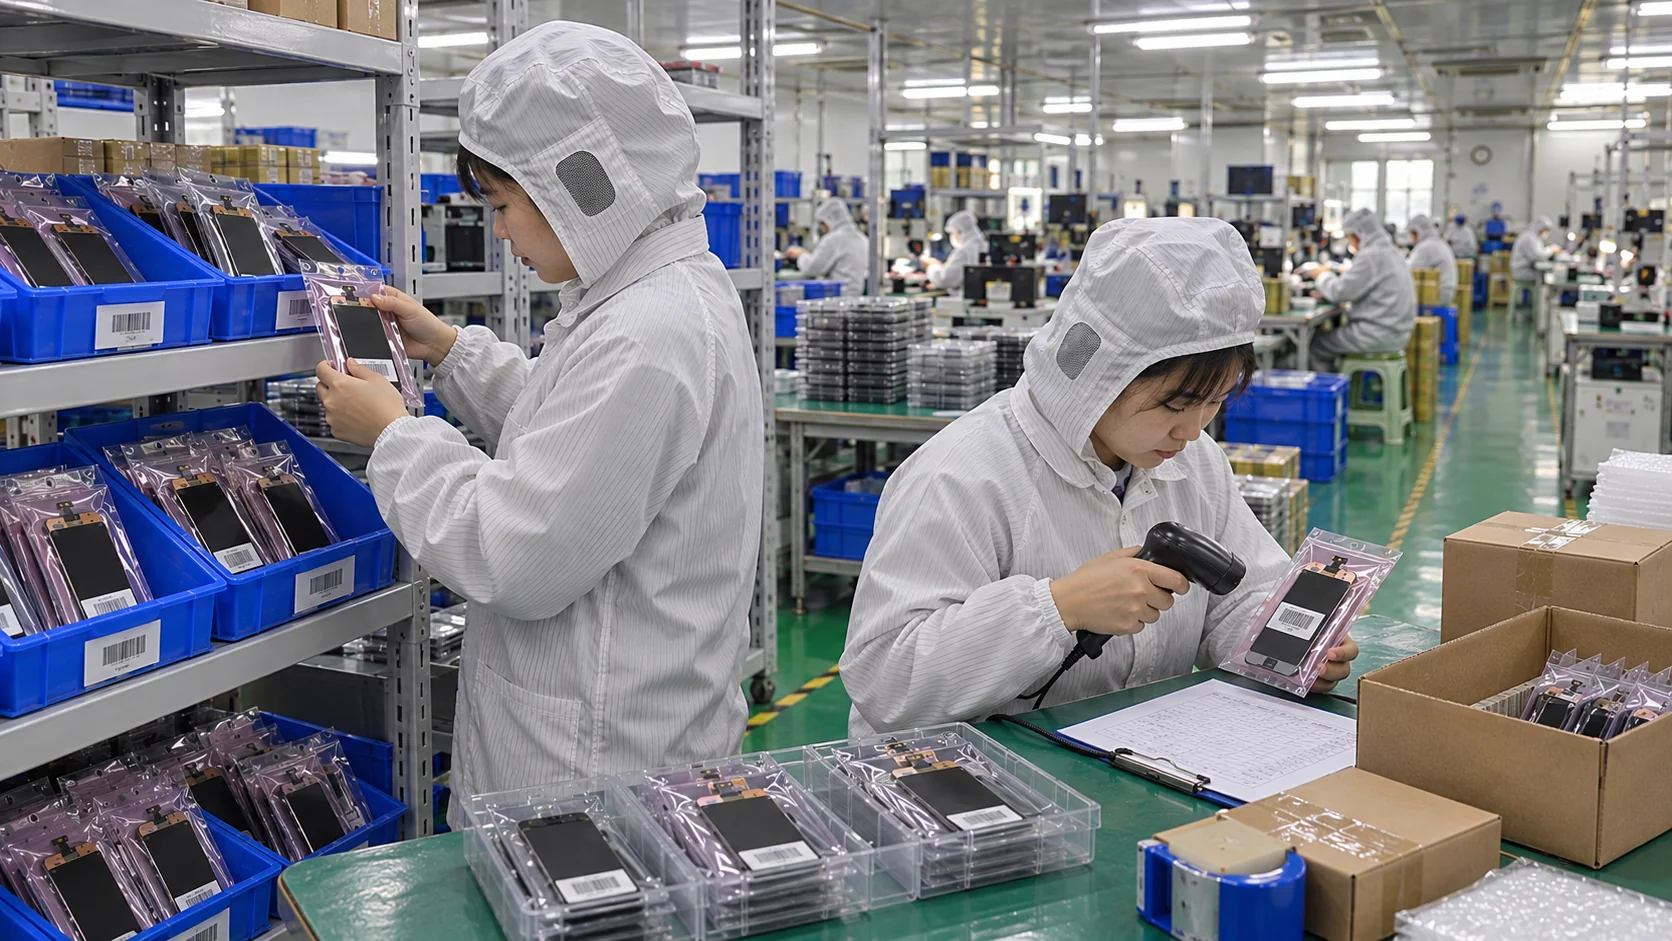
- Verify the product, then observe uptake. Start by testing iPhone LCD samples against the intended specification. Then run a controlled sales or repair trial, recording availability, billable sales or completed repairs, and exceptional events. Set its scope and duration for your business.
- Record what you learn. Keep the approved specification and the result with the SKU.
Check trial units against the agreed iPhone XR LCD replacement screen specifications, then record sales and returns against that exact configuration.
Turn the Evidence into a Sourcing Shortlist
Summarize each SKU on one line so the decision can be reviewed later:
| Shortlist field | What to enter |
|---|---|
| Product and scope | Exact SKU/configuration, market, channel and observation dates |
| Observed activity | Paid units, verified exposure time, order frequency and customer concentration |
| Primary evidence status | Main classification and the records supporting it |
| Additional flags | Stockouts, exceptional orders, promotions, returns or other limitations; flags can overlap |
| Product validation | Approved specification and sample status |
| Next review | Action, responsible person and review date |
A strong sales signal may justify moving a verified SKU to purchasing review. An availability gap calls for better evidence, and an unresolved return pattern calls for batch tracing. Record the next action rather than assigning every SKU an order quantity.
A reviewed shortlist supports planning a mixed-model iPhone LCD order. Current usable stock, confirmed incoming units, delivery requirements and supplier terms then determine how much to buy.
Keep customer-level and cost data in your internal worksheet. For a supplier enquiry, share the business type, target market, compatible models, required specifications and destination. Add estimated quantities or monthly volume if available, and sample requirements for unverified configurations.
Review the Classification as New Evidence Arrives
Review classifications after restocking or when the next comparable sales period closes. Record the previous decision, the new evidence and the reason for any change. Check whether project customers reorder and whether traced returns affect the product assessment.
Keep the comparison rules consistent. Changing the observation window or excluding transactions only because they conflict with the previous conclusion makes the review unreliable.
Frequently Asked Questions
How much history is enough before calling a SKU fast-moving?
Use enough comparable trading periods to see whether paid activity recurs across dates or customer orders. Check that the SKU had a reasonable opportunity to sell. A short in-stock window or one project order is a reason for further review, not a universal fast-moving label.
Should LCD and OLED sales for the same iPhone model be combined?
Keep them separate for product selection and purchasing. A model-level total can describe general repair interest, but it does not identify demand for the specific LCD configuration you plan to source.
What should a buyer with no sales history do first?
Log model-specific enquiries and confirmed requirements. Verify the product with samples, then observe a controlled sales or repair trial. Record availability alongside billable sales or completed repairs so that low activity can be interpreted.
Does a low-volume SKU always need to be discontinued?
No. An infrequent repair part may support a service commitment or a valuable customer account. Compare that business role with holding cost and the feasibility of special ordering. Low observed sales alone do not settle the decision.
What if one customer accounts for most sales?
Check whether the orders come from an ongoing programme or a single project. Recurring demand from one customer can be commercially useful, but it carries concentration risk and does not establish broad demand across the market.
Put the Shortlist to Work
A useful shortlist identifies the exact configuration, explains the sales evidence and records what still needs checking. Confirm the specification before turning a candidate into a purchase line.
Send your compatible models, required LCD specifications and destination to request a wholesale quotation for your shortlisted iPhone LCD models. Include estimated quantities and sample requirements where available. If quantities are undecided, request specification confirmation first.